

In this blog, I have put together a list of 50 KPIs that marketeers should know of. In this day and age, making data-driven decisions are extremely important.
Marketing KPIs are essential metrics that help businesses measure the success of their marketing campaigns and make informed decisions to optimize their strategies. KPIs provide insights into campaign effectiveness, ROI, customer behavior, and market trends.
By analyzing KPI data, businesses can optimize their marketing strategies to attract and retain more customers, adjust their budgets, stay ahead of market trends, and monitor competitors. Ultimately, marketing KPIs provide valuable data that helps businesses make better decisions and achieve greater marketing success.
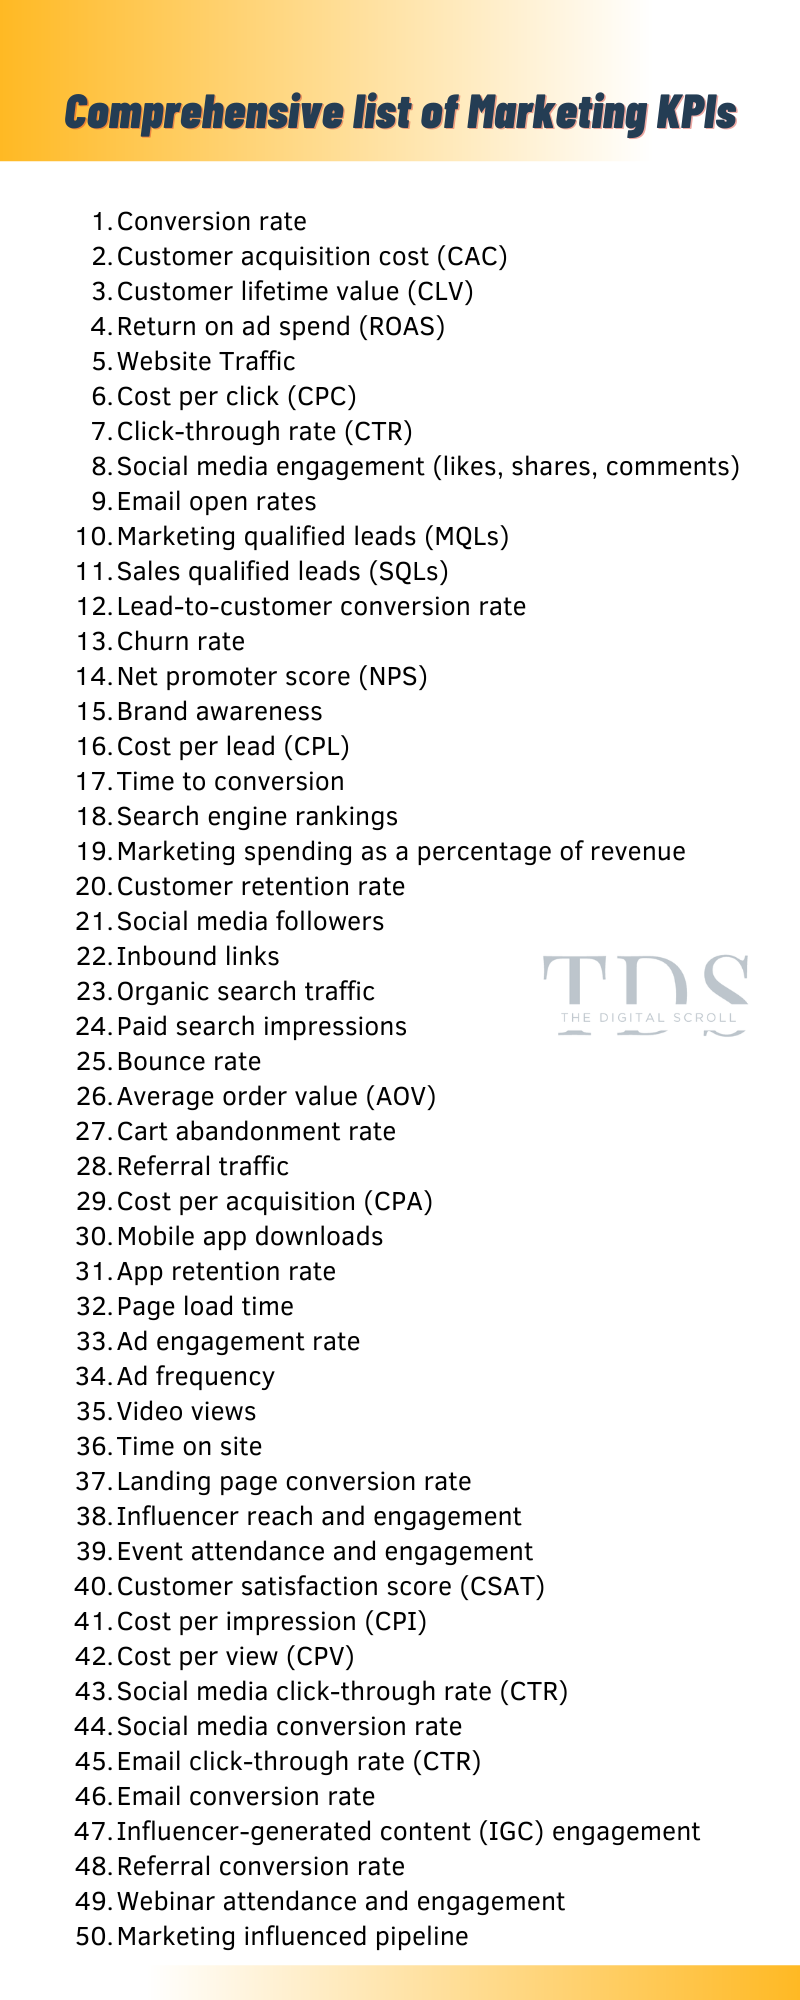
List of 50 Marketing KPIs
Keep reading if you want the explanation for each of these 50 KPIs!!
Conversion rate
Conversion rate is a crucial metric in digital marketing that measures the percentage of website visitors who complete a desired action, such as making a purchase or filling out a form. A high conversion rate indicates that a website is effectively engaging and persuading its visitors to take a desired action, while a low conversion rate suggests that there may be room for improvement in the website’s design, content, or user experience.
To optimize conversion rates, marketers can use various strategies such as A/B testing, improving website navigation, simplifying forms, and creating compelling calls to action. Improving conversion rates can ultimately lead to higher revenue and ROI for businesses.
Customer acquisition cost (CAC)
Customer Acquisition Cost (CAC) is a crucial marketing KPI that measures the average cost a business incurs to acquire a new customer. It takes into account all expenses related to marketing and sales, such as advertising, sales commissions, salaries, and overhead costs, and divides them by the number of new customers acquired in a given period.
A high CAC indicates that a business is spending too much money on acquiring customers, which can affect profitability and sustainability in the long run. To optimize CAC, marketers can use various tactics such as targeting high-quality leads, improving the conversion rate of marketing campaigns, and reducing customer churn. By tracking CAC, businesses can make informed decisions about their marketing budget and strategy to drive growth and profitability.
Customer lifetime value (CLV)
Customer Lifetime Value (CLV) is a marketing KPI that estimates the total revenue a business can expect to generate from a single customer over their lifetime. It takes into account factors such as the customer’s average purchase value, purchase frequency, and customer retention rate.
A high CLV indicates that a business is effectively retaining customers and generating long-term revenue from them. By tracking CLV, businesses can make informed decisions about their customer acquisition and retention strategies, allocate their marketing budget more effectively, and improve overall profitability.
Return on ad spend (ROAS)
Return on Ad Spend (ROAS) is a marketing KPI that measures the revenue a business generates from its advertising campaigns relative to the amount spent on those campaigns. It is calculated by dividing the revenue generated by the advertising spend.
A high ROAS indicates that a business is generating a positive return on its advertising investment, while a low ROAS suggests that adjustments may be needed to improve campaign effectiveness. ROAS is a useful metric for optimizing advertising budgets and maximizing ROI.
Website traffic
Website traffic is a marketing KPI that measures the number of visitors to a website over a specific period of time. It provides insights into the effectiveness of a website’s marketing strategies and the level of audience engagement.
By tracking website traffic, businesses can identify opportunities to improve their website’s content, design, and user experience to drive more traffic and ultimately increase conversions and revenue.
Cost per click (CPC)
Cost per Click (CPC) is a marketing KPI that measures the cost a business incurs for each click on an online ad. It is calculated by dividing the total cost of the ad campaign by the number of clicks received.
A low CPC indicates that a business is effectively managing its advertising budget and generating cost-effective clicks, while a high CPC may suggest a need for campaign optimization. By tracking CPC, businesses can optimize their advertising strategies and maximize ROI.
Click-through rate (CTR)
Click-through rate (CTR) is a marketing KPI that measures the percentage of clicks on a specific link or ad out of the total number of impressions or views.
A high CTR indicates that the ad is effectively engaging the target audience and generating interest, while a low CTR suggests a need for improvements in ad copy, design, or targeting. By tracking CTR, businesses can optimize their advertising strategies to maximize ROI and drive more traffic and conversions.
Social media engagement (likes, shares, comments)
Social media engagement is a marketing KPI that measures the level of audience interaction with social media content, including likes, shares, and comments. High engagement indicates that content is resonating with the audience, building brand awareness, and fostering customer loyalty.
By tracking social media engagement, businesses can identify opportunities to optimize their social media content and drive increased engagement and overall social media performance.
Email open rates
Email open rate is a marketing KPI that measures the percentage of recipients who open a marketing email. A high open rate indicates that the email subject line and sender name were effective in capturing the recipient’s attention, while a low open rate may suggest the need for improvements in these areas.
By tracking email open rates, businesses can optimize their email marketing strategies and increase engagement and conversion rates.
Marketing qualified leads (MQLs)
Marketing Qualified Leads (MQLs) are potential customers who have shown a level of interest in a company’s products or services based on their engagement with marketing campaigns or materials.
MQLs have been identified as having a higher likelihood of becoming customers due to their demonstrated interest and engagement. MQLs are often passed on to sales teams for further qualification and nurturing.
Sales qualified leads (SQLs)
Sales Qualified Leads (SQLs) are potential customers who have been identified by the sales team as having a higher likelihood of making a purchase due to their level of engagement and fit with the company’s target customer profile. SQLs have been vetted by the sales team and are deemed ready for direct sales outreach and follow-up.
Lead-to-customer conversion rate
Lead-to-customer conversion rate is a marketing KPI that measures the percentage of leads that convert into paying customers. A high conversion rate indicates that the company is effectively nurturing and qualifying leads, resulting in a higher likelihood of converting them into customers.
By tracking lead-to-customer conversion rate, businesses can optimize their lead nurturing and sales processes to increase customer acquisition and revenue.
Churn rate
Churn rate is a marketing KPI that measures the percentage of customers who stop doing business with a company over a specific period of time. A high churn rate can indicate issues with product quality, customer service, or competition.
By tracking churn rate, businesses can identify opportunities to improve customer retention strategies, reduce churn, and ultimately increase revenue and profitability.
Net promoter score (NPS)
Net Promoter Score (NPS) is a marketing KPI that measures customer loyalty and satisfaction by asking customers a single question: “How likely are you to recommend our product or service to a friend or colleague?” The resulting score, typically on a scale of 0-10, indicates the level of customer satisfaction and likelihood of future business.
By tracking NPS, businesses can identify areas for improvement and measure the effectiveness of customer experience initiatives.
Brand awareness
Brand awareness is a marketing KPI that measures the level of familiarity and recognition that consumers have with a particular brand. It indicates the degree to which a brand is top-of-mind and associated with specific products or services.
Tracking brand awareness, businesses can help identify opportunities to increase brand visibility, optimize marketing strategies, and ultimately drive increased sales and revenue.
List of 50 Marketing KPIs
Cost per lead (CPL)
Cost per Lead (CPL) is a marketing KPI that measures the cost a business incurs for each new lead acquired through marketing efforts. It is calculated by dividing the total cost of marketing campaigns by the number of new leads generated.
A low CPL indicates that a business is effectively managing its marketing budget and generating cost-effective leads, while a high CPL may suggest a need for campaign optimization. By tracking CPL, businesses can optimize their marketing strategies to maximize ROI and drive more qualified leads and revenue.
Time to conversion
Time to conversion is a marketing KPI that measures the length of time it takes for a lead to become a paying customer.
It represents the duration of the customer journey from initial engagement to conversion and can indicate the effectiveness of a business’s lead nurturing and sales processes. By tracking time to conversion, businesses can optimize their marketing and sales strategies to reduce the time it takes to convert leads and increase revenue.
Search engine rankings
Search engine rankings are a marketing KPI that measures a website’s position in search engine results pages for specific keywords or phrases. Higher rankings indicate that a website is more visible and likely to receive organic traffic from search engines. By tracking search engine rankings, businesses can optimize their website and content to improve search engine visibility and drive increased organic traffic and revenue.
Marketing spend as a percentage of revenue
Marketing spend as a percentage of revenue is a marketing KPI that measures the proportion of a company’s revenue that is allocated to marketing expenses. This KPI helps businesses to assess the efficiency and effectiveness of their marketing spending and determine the return on investment (ROI) for marketing activities.
By tracking marketing spend as a percentage of revenue, businesses can make informed decisions about marketing budget allocation and optimize their marketing strategies for maximum ROI.
Customer retention rate
Customer retention rate is a marketing KPI that measures the percentage of customers who continue to do business with a company over a specific period of time. It is an important indicator of customer loyalty and satisfaction, as well as the effectiveness of a business’s customer retention strategies. By tracking customer retention rate, businesses can identify opportunities to improve customer experience and reduce churn, ultimately leading to increased revenue and profitability.
Social media followers
Customer retention rate is a marketing KPI that measures the percentage of customers who continue to do business with a company over a specific period of time. It is an important indicator of customer loyalty and satisfaction, as well as the effectiveness of a business’s customer retention strategies.
By tracking customer retention rate, businesses can identify opportunities to improve customer experience and reduce churn, ultimately leading to increased revenue and profitability.
Inbound links
Inbound links, also known as backlinks, are a marketing KPI that measures the number and quality of links pointing to a website from external sources.
Inbound links are important for search engine optimization (SEO) as they can improve a website’s search engine rankings and drive organic traffic. By tracking inbound links, businesses can optimize their SEO strategies to increase website visibility and drive more traffic and revenue.
Organic search traffic
Organic search traffic is a marketing KPI that measures the amount of traffic a website receives from search engine results pages without any paid promotion. It represents the number of visitors who find a website through organic search results and indicates the effectiveness of a business’s search engine optimization (SEO) strategies.
By tracking organic search traffic, businesses can optimize their SEO tactics to increase website visibility and drive more traffic and revenue.
Paid search impressions
Paid search impressions are a marketing KPI that measures the number of times an ad is displayed to a potential customer in paid search results.
It indicates the reach of a business’s paid search campaigns and can help to optimize ad targeting and budget allocation. By tracking paid search impressions, businesses can improve the effectiveness of their paid search campaigns and increase the likelihood of driving conversions and revenue.
Bounce rate
Bounce rate is a marketing KPI that measures the percentage of visitors to a website who navigate away from the site after viewing only one page. It can indicate the relevance and engagement level of a website’s content and design, as well as the effectiveness of marketing and advertising campaigns.
By tracking bounce rate, businesses can optimize their website and marketing strategies to improve engagement, reduce bounce rates, and increase conversions and revenue.
Average order value (AOV)
Average order value (AOV) is a marketing KPI that measures the average amount of money spent per order by customers. It can indicate the effectiveness of a business’s pricing strategy and the quality of its product offerings. By tracking AOV, businesses can identify opportunities to increase revenue by encouraging customers to spend more per transaction.
This can be achieved through tactics such as cross-selling, upselling, and offering discounts for larger orders. Increasing AOV can have a significant impact on overall revenue and profitability for a business.
Cart abandonment rate
Cart abandonment rate is a marketing KPI that measures the percentage of online shoppers who add items to their cart but do not complete the purchase. It can indicate the effectiveness of a business’s website design, checkout process, and pricing strategy.
By tracking cart abandonment rate, businesses can identify opportunities to optimize their website and marketing strategies to reduce cart abandonment, increase conversions, and drive revenue. Tactics such as offering free shipping, simplifying checkout, and retargeting customers with abandoned cart emails can help reduce cart abandonment rates.
Referral traffic
Referral traffic is a marketing KPI that measures the amount of traffic to a website that comes from external sources, such as other websites or social media platforms. It can indicate the effectiveness of a business’s referral marketing and partnership strategies.
By tracking referral traffic, businesses can identify the most effective sources of referral traffic and optimize their referral marketing and partnership programs to increase traffic, conversions, and revenue.
Cost per acquisition (CPA)
Cost per acquisition (CPA) is a marketing KPI that measures the cost of acquiring a new customer. It takes into account the total cost of all marketing and sales efforts that lead to a conversion, divided by the number of customers acquired.
By tracking CPA, businesses can optimize their marketing and sales strategies to reduce costs, increase efficiency, and drive more revenue. Lowering CPA while maintaining a high conversion rate can significantly increase profitability for a business.
Mobile app downloads
Mobile app downloads is a marketing KPI that measures the number of times a mobile app is downloaded by users. It can indicate the effectiveness of a business’s mobile app marketing and promotion strategies. By tracking app downloads, businesses can optimize their app store optimization (ASO), advertising campaigns, and user acquisition efforts to increase downloads, user engagement, and revenue.
Increasing app downloads can also help to improve brand awareness and expand a business’s reach to new audiences.
App retention rate
App retention rate is a marketing KPI that measures the percentage of users who continue to use a mobile app after a certain period of time, typically 30, 60, or 90 days. It can indicate the effectiveness of a business’s user experience, customer support, and engagement strategies.
By tracking app retention rate, businesses can identify opportunities to improve user engagement and retention, optimize their mobile app experience, and increase revenue through increased user activity and in-app purchases. Improving app retention rate can also help to reduce churn and increase customer lifetime value.
Page load time
Page load time is an SEO KPI that measures the time it takes for a web page to fully load and display its content. It can indicate the effectiveness of a business’s website design and performance optimization efforts. By tracking page load time, businesses can identify opportunities to optimize their website speed, improve user experience, and reduce bounce rates.
Improving page load time can also help to improve search engine rankings, increase conversions, and drive revenue.
Ad engagement rate
Ad engagement rate is a marketing KPI that measures the percentage of people who interact with an advertisement, such as by clicking, liking, or sharing. It can indicate the effectiveness of a business’s ad targeting and messaging strategies.
By tracking ad engagement rate, businesses can identify which ad types, formats, and messaging are most effective in engaging their target audience, optimize their ad campaigns, and increase ad effectiveness, brand awareness, and conversions. Improving ad engagement rate can also help to reduce ad costs and increase ROI.
Ad frequency
Ad frequency is a marketing KPI that measures the number of times a single individual is exposed to an advertisement within a specific time period, such as a day, week, or month. It can indicate the effectiveness of a business’s ad targeting and messaging strategies.
By tracking ad frequency, businesses can optimize their ad campaigns to ensure that they are not over-exposing their audience to the same ads, which can lead to ad fatigue and reduced engagement. A proper ad frequency can help to maximize brand awareness and conversions while minimizing ad costs.
Video views
Video views are a marketing KPI that measures the number of times a video has been watched by users.
Time on site
Time on site is a marketing KPI that measures the amount of time visitors spend on a website. It can indicate the effectiveness of a business’s website design and content in engaging visitors and keeping them interested.
By tracking time on site, businesses can identify opportunities to optimize their website experience, reduce bounce rates, and increase conversions. Improving time on site can also help to improve search engine rankings and drive revenue.
Landing page conversion rate
Landing page conversion rate is a marketing KPI that measures the percentage of visitors who take a desired action on a landing page, such as filling out a form or making a purchase. It can indicate the effectiveness of a business’s landing page design and messaging in converting visitors into leads or customers.
By tracking landing page conversion rate, businesses can identify opportunities to optimize their landing pages, improve user experience, and increase conversions. Improving landing page conversion rate can also help to reduce customer acquisition costs and increase ROI.
List of 50 Marketing KPIs
Influencer reach and engagement
Influencer reach and engagement is a marketing KPI that measures the size of an influencer’s audience and the level of interaction their content receives, such as likes, shares, and comments.
It can indicate the effectiveness of a business’s influencer marketing campaigns in reaching and engaging with its target audience. By tracking influencer reach and engagement, businesses can identify the most effective influencers to partner with, optimize their influencer marketing strategies, and increase brand awareness and conversions.
Event attendance and engagement
Event attendance and engagement are marketing KPI that measures the number of attendees and the level of interaction at an event, such as conferences, trade shows, and product launches. It can indicate the effectiveness of a business’s event marketing strategies in attracting and engaging with its target audience.
Customer satisfaction score (CSAT)
Customer satisfaction score (CSAT) is a marketing KPI that measures the level of customer satisfaction with a product, service, or experience. It typically involves asking customers to rate their satisfaction on a scale, such as from 1 to 5.
By tracking CSAT, businesses can identify areas for improvement and measure the effectiveness of their customer service and marketing strategies in meeting customer expectations. Improving CSAT can help to increase customer retention, loyalty, and advocacy.
Cost per impression (CPI)
Cost per impression (CPI) is a marketing KPI that measures the cost of each time an ad is displayed to a user. It is calculated by dividing the total cost of the ad campaign by the number of impressions generated.
CPI is typically used in display advertising, where advertisers pay for each time their ad is shown to a user. By tracking CPI, businesses can evaluate the efficiency and cost-effectiveness of their advertising campaigns and adjust their strategies accordingly.
Cost per view (CPV)
Cost per view (CPV) is a marketing KPI that measures the cost of each time a video ad is viewed by a user. It is calculated by dividing the total cost of the ad campaign by the number of video views generated.
CPV is typically used in video advertising, where advertisers pay for each time their video ad is viewed by a user. By tracking CPV, businesses can evaluate the effectiveness and cost-effectiveness of their video ad campaigns and adjust their strategies accordingly.
Social media click-through rate (CTR)
Social media click-through rate (CTR) is a marketing KPI that measures the ratio of clicks on a social media post to the number of impressions generated. It is calculated by dividing the number of clicks on a post by the number of impressions, and then multiplying the result by 100 to express it as a percentage.
Social media CTR is used to evaluate the effectiveness of social media posts in driving website traffic and conversions. A high CTR indicates that a post is engaging and relevant to its audience, while a low CTR may suggest the need for optimization or content improvement.
Social media conversion rate
Social media conversion rate is a marketing KPI that measures the number of conversions generated from social media posts or advertising campaigns. It is calculated by dividing the number of conversions (such as purchases, sign-ups, or downloads) by the total number of clicks on a social media post or ad. Social media conversion rate helps businesses understand the effectiveness of their social media marketing efforts in generating conversions and driving revenue.
A higher conversion rate indicates that the social media campaign is successfully converting users into customers, while a lower conversion rate may suggest the need for optimization or targeting improvements.
Email click-through rate (CTR)
Email click-through rate (CTR) is a marketing KPI that measures the percentage of recipients who click on a link within an email. It is calculated by dividing the number of clicks by the number of emails delivered, multiplied by 100.
Email CTR is a key metric for evaluating the effectiveness of email campaigns and determining the engagement level of subscribers. A high CTR indicates that the email content is engaging and resonating with the audience, while a low CTR may suggest that the email needs improvement or that the audience needs better targeting.
Email conversion rate
Email conversion rate is a marketing KPI that measures the percentage of recipients who clicked on a link within an email and completed a desired action, such as making a purchase or filling out a form.
It is calculated by dividing the number of conversions by the number of emails delivered, multiplied by 100. Email conversion rate is a critical metric for evaluating the success of email campaigns and assessing the overall ROI of email marketing efforts.
It allows marketers to determine which campaigns are most effective at driving conversions and optimizing future email marketing strategies.
Influencer-generated content (IGC) engagement
Influencer-generated content (IGC) engagement measures the level of engagement with content created by social media influencers, such as likes, shares, and comments. It helps marketers evaluate the effectiveness of influencer marketing campaigns and determine the return on investment (ROI) of working with specific influencers.
IGC engagement is an important metric for brands to consider when selecting and working with influencers, as it provides insights into the level of impact their content has on their target audience.
Referral conversion rate
Referral conversion rate measures the percentage of website visitors who were referred to the site by another source, such as a social media platform or another website, and completed a desired action, such as making a purchase or filling out a form. It helps evaluate the effectiveness of referral campaigns and the quality of traffic from different sources.
Webinar attendance and engagement
Webinar attendance and engagement measure the number of attendees and their level of interaction during a webinar, such as questions asked, polls answered, and chats. It helps evaluate the effectiveness of webinars in generating leads and educating the audience.
Marketing influenced pipeline
Marketing-influenced pipeline is a KPI that measures the total value of sales opportunities generated by marketing efforts. It includes leads generated through various marketing channels, such as advertising, content marketing, events, and social media, that have been influenced by marketing activities.
This metric provides insights into the effectiveness of marketing campaigns in generating potential customers and driving revenue growth.
By measuring the marketing-influenced pipeline, companies can allocate their resources more effectively and optimize their marketing strategies to generate more sales opportunities.
Click here to get a list of 50 Marketing KPIs!
Conclusion
Remember that not all KPIs are created equal, and you should only track the ones that align with your marketing goals and objectives.
It’s also important to regularly review and analyze your KPIs. This helps you to identify areas for improvement and optimize your marketing campaigns for maximum effectiveness.

Leave a reply to The Importance of Personal Branding for Entrepreneurs and Professionals – The Digital Scroll Cancel reply